Mosaic Method
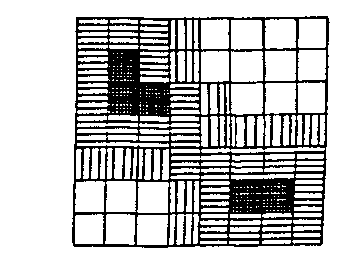
Copyright (c) Susan Laflin. August 1999. >This method is most effective on a colour terminal, where the different ranges of values of height can be mapped onto different colours, but output on a black and white terminal with a limited range of patterns may also be used. If there are four different patterns, then the range of spot-heights may be divided into four subranges, one corresponding to each pattern. A square filled with the appropriate pattern is drawn surrounding the corresponding (x,y) position. An example of the resulting mosaic is shown in the figure.

Example of Mosaic Output.
The more colours available on the terminal, the smaller is the size of interval in the z-direction corresponding to each colour and so the better the resolution in that direction. However, to give a more accurate impression of the shape of the surface, it is also necessary to improve the resolution in the x and y directions as well. This may be done in steps, or you may fit a surface patch and move directly to the maximum possible resolution.
To consider the step by step method, it is necessary to interpolate between points in the mesh, as indicated in the next figure. If the points A,B,C and D are data points in the original grid, then to produce a new grid with the sides of the mesh halved, so that there are four times as many patches, it is necessary to calculate five more points. The mid-point of the side AB may be estimated as the average of the data points at A and B and similarly for the other three sides. Finally, the centre of the square may be estimated as the average of the four corner points.

Interpolation over a Mesh
The mosaic of this new mesh may then be output and will consist of a larger number of smaller squares. This process may be repeated as often as you wish, the limit being reached when the squares of the mosaic have been reduced to one pixel in size. However this is a very slow process if such accuracy is needed.
The second method is to use the equation of a surface patch (e.g. the bi-linear surface patch ) fitted to the original square and then to move immediately to the highest resolution available on the terminal. For each scan-line across the patch, the equation od the patch is used to calculate the points at which the line changes from one colour to the next and these can quickly be drawn in until the entire diagram has been shaded. This final output gives the same picture as shaded contours although it is derived by different reasoning.

Shading along Scan-lines